Mrinal's Portfolio
Welcome to my Portfolio
I am a passionate and results-oriented marketing professional with experience across B2B and B2C sectors. Throughout my career, I've driven project success in construction, medical devices, and education. From leading product launches to crafting marketing strategies, I leverage data and creativity to achieve measurable results. View my portfolio to see more of my marketing content and projects from the past . I am proficient in using design tools like Tableau, Canva , Adobe Photoshop, as well as project management tools like Trello & Jira .
.jpg/:/rs=w:400,cg:true,m)
Tableau Projects

Cost of Living Index 2024
Global living costs are surging due to a perfect storm of factors: soaring inflation, supply chain bottlenecks, and stagnant wages. These challenges, amplified by geopolitical tensions and climate change, are squeezing household budgets worldwide. This Tableau dashboard offers a visual representation of the varying cost of living index across different countries in 2024.
Data Source : https://www.kaggle.com/datasets/myrios/cost-of-living-index-by-country-by-number-2024/data
Starbucks - Nutrition info for the menu items.
Are you a coffee lover who can't resist your daily Starbucks fix? If so, have you ever stopped to think about how much sugar or how many calories are in your favorite drink? As a fan of Starbucks hot chocolate, I was shocked to discover it packs 380 calories and an astonishing 55 grams of sugar! Check out the Tableau dashboard to see the calorie count for your go-to Starbucks drink—you might be surprised at what you find!
Data Source : https://www.kaggle.com/datasets/henryshan/starbucks
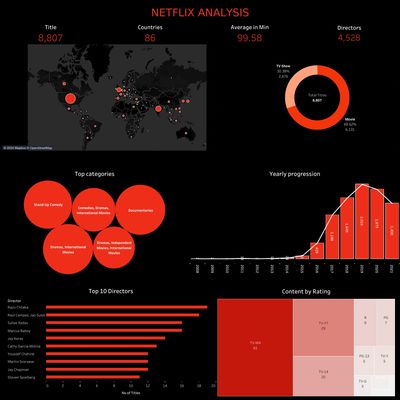
Netflix Analysis 2021
Netflix, one of the leading media and video streaming platforms, boasts a vast library of over 8,000 movies and TV shows. By mid-2021, they had amassed more than 200 million subscribers worldwide. This Tableau dashboard provides an in-depth analysis of TV shows and movies on Netflix, focusing on directors, ratings, and genres.
Data Source : https://www.kaggle.com/datasets/shivamb/netflix-shows
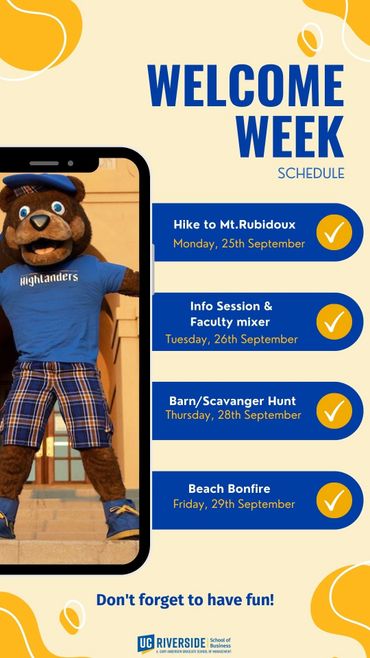
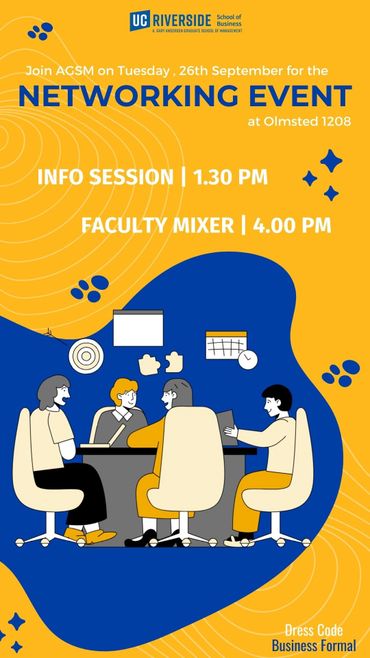
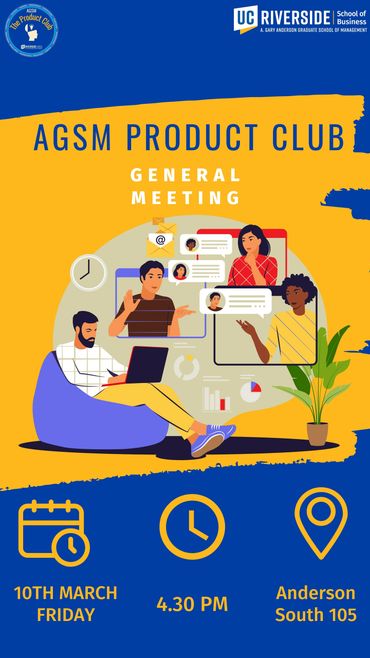
Canva Projects - Marketing Content for Organizations and Clubs